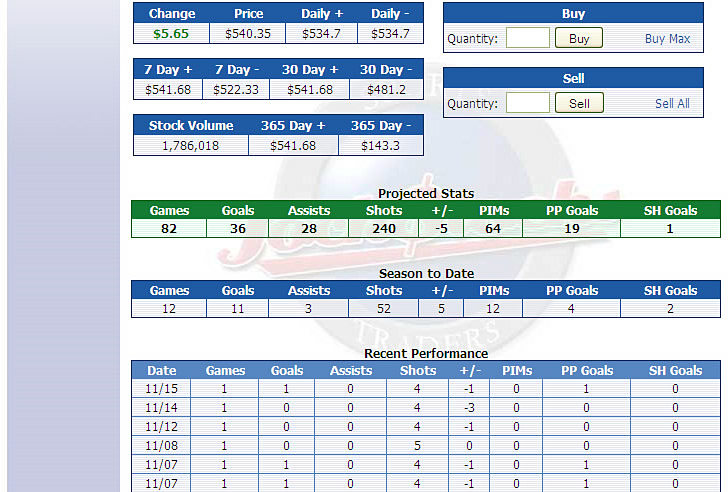
Below
is a snapshot of the bulk of a player profile page. The
top of each player profile has their basic information-
team, birthdate, years of experience at the time they were
IPO'd, etc. But here you can see a lot of information about
a player's performance, both here and 'in real life'. You
can see a stock's current price, as well as lows and highs
from the day, the week, the month, and the year. This is
an indicator of whether the stock might be a good long term
investment; so is stock volume as that shows how many total
shares are being held by all members combined. While most
of the time you'll want to 'buy max' of a player if you
buy shares at all, you do have the option of choosing the
number of shares. Then you'll note the stock's projections
are listed- a very pertinent thing to look at when making
buying decisions because the more a player's stats today
are above their projections, the better their dividend in
the morning. Remember, we display projections for an entire
season, but our dividend formulas divide those stats to
'per game' projections when figuring dividends. Below that
you'll see the player's stats for the current season, both
cumulative and per day. We do our best to keep all information
up-to-date. By the way, you can also get projections for
all listed stocks via links on the market page.
Some members choose to use spreadsheets to help them decide
which stocks to buy- spreadsheets that have these projections
already broken down to a per game basis. Let's move on-
click the Your Portfolio link above.
|